Thursday, 25 February 2016

Wolff-Parkinson-White


Wolff–Parkinson–White syndrome (WPW) is one of several disorders of the electrical system of the heart that are commonly referred to as pre-excitation syndromes.
WPW is caused by the presence of an abnormal accessory electrical conduction pathway between the atria and the ventricles. Electrical signals traveling down this abnormal pathway (known as the bundle of Kent) may stimulate the ventricles to contract prematurely, resulting in a unique type of supraventricular tachycardia referred to as an atrioventricular reciprocating tachycardia.


WPW ECG Examples:


Saturday, 13 February 2016

Hyperkaelemia ECG Features

With mild to moderate hyperkalemia, there is reduction of the size of the P wave and development of peaked T waves. Severe hyperkalemia results in a widening of the QRS complex, and the ECG complex can evolve to a sinusoidal shape. There appears to be a direct effect of elevated potassium on some of the potassium channels that increases their activity and speeds membrane repolarization. Also, (as noted above), hyperkalemia causes an overall membrane depolarization that inactivates many sodium channels. The faster repolarization of the cardiac action potential causes the tenting of the T waves, and the inactivation of sodium channels causes a sluggish conduction of the electrical wave around the heart, which leads to smaller P waves and widening of the QRS comple.


To be completed

Thursday, 11 February 2016

Basic Electrophysiology


The heart’s electrical activity is represented on the monitor or ECG tracing by three basic waveforms: the P wave, the QRS complex, and the T wave. A U wave is sometimes present.
Between the waveforms are the following segments and intervals: the PR interval, the ST segment, and the QT interval. Although the letters themselves have no special significance, each component represents a particular event in the depolarization–repolarization cycle.

Calculating the Heart Rate


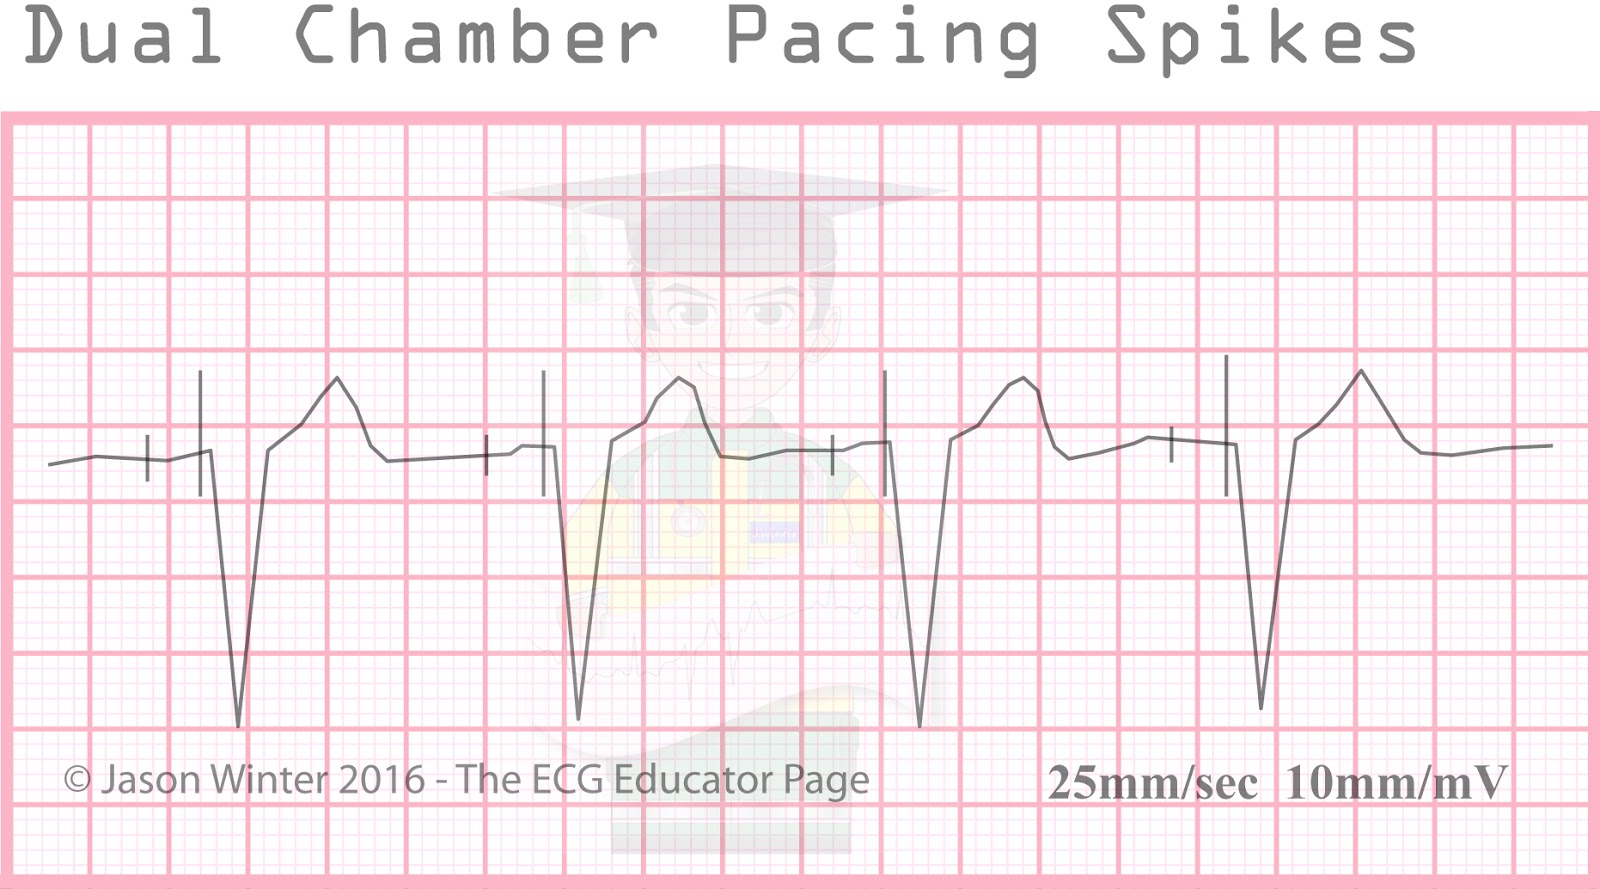
There are several methods for determining heart rate. Our first method is simple. Count the number of QRS complexes over a 6 second interval. Multiply by 10 to determine heart rate. This method works well for both regular and irregular rhythms. In the first image, we can count 5 QRS complexes, so the heart rate is 50.

The second method uses small boxes. Count the number of small boxes for a typical R-R interval. Divide this number into 1500 to determine heart rate.


ECG tracings are recorded on grid paper. The horizontal axis of the 
ECG paper records time, with black marks at the top indicating 3 second intervals. Each second is marked by 5 large grid blocks. Thus each large block equals 0.2 second. The vertical axis records EKG amplitude (voltage). Two large blocks equal 1 millivolt (mV). Each small block equals 0.1 mV. Within the large blocks are 5 small blocks, each representing 0.04 seconds. 


Wednesday, 10 February 2016

ECG Module on Myocardial Infarction & Ischaemia

http://www.cardiorhythmsonline.co.uk/collections/e-learning-modules/products/the-ecg-in-myocardial-infarction-ischaemia

Acute Inferoposterior MI Examples


R-wave Progression


  • normal R-wave progression in the praecordial leads 
    • normal chest lead ECG shows an rS-type complex in lead V1 with a steady increase in the relative size of the R-wave toward the left chest and a decrease in the S wave amplitude. Leads V5 and V6 generally show a qR-type complex, with R-wave amplitude in V5 often taller than V6 because of the attenuating effect of the lungs. Normal variations include: narrow QS and rSr patterns in V1 and qRs and R patterns in V5 and V6
    • at some point, generally around the V3 or V4 position, the QRS complex changes from predominately negative to predominately positive and the R/S ratio becomes>1. This is known as the transition zone. In some normal individuals, the transition may be seen as early as V2. This is called early transition. At times, transition may be delayed until V4 to V5. This is called delayed transition
    • normal R-wave height in V3 is usually greater than 2 mm 
    • if the height of the r wave in leads V1 to V4 remains extremely small, we say there is "poor R-wave progression" In the literature, definitions of poor R-wave progression have been variable, using criteria such as R-wave less than 2-4 mm in leads V3 or V4 and/or the presence of reversed R-wave progression defined as R in V4
  • poor R wave progression secondary to previous anterior myocardial infarction 
    • in anterior myocardial infarctions, this produces Q waves in the right and midprecordial leads (V1-V4) 
      • however, in a significant number of patients the Q waves do not persist
      • with previously documented anterior myocardial infarction, the reported estimate of poor Rwave progression on subsequent ECGs varies between 20% and 30%
      • average length of time for the complete disappearance of the abnormal Q waves is 1.5 years
      • the magnitude of the subsequent leftward forces is less than in patients with poor Rwave progression from other causes
      • on the ECG, this results in a diminuation of R-wave amplitude in standard lead I 

ST Segment Elevation Morphologies


  1. Obliquely straight
  2. Concave
  3. Non concave (CONVEX)


ST depression & T wave inversion causes


  1. LVH with strain pattern
  2. WPW with pre-excitation
  3. Right Ventricular Hypertrophy (RVH)
  4. Digitalis
  5. Subarachnoid Hemorrhage/CVA
  6. Posterior STEMI
  7. Ischemia (lead with upright QRS)
  8. Ischemia (wellen's patterns)
  9. Right Bundle Branch Block (RBBB)
  10. Left Bundle Branch Block (LBBB) 


Types of T-waves


How to calculate the QTc (Bazett's Formula)


LVH by voltage criteria - (Sokolow-Lyon Index)


P wave Abnormalities


  1. Right Atrial Enlargement (RAE) or (p Pulmonale)
  2. Left Atrial Enlargement (LAE) or (p Mitrale)
  3. Right + Left Atrial Enlargement (p Biatriale)


Cardiac Axis Made Easy


Normal Axis = QRS axis between -30 and +90 degrees.

Left Axis Deviation = QRS axis less than -30 degrees.

Right Axis Deviation = QRS axis greater than +90 degrees.

Extreme Axis Deviation = QRS axis between -90 and 180 degrees.


Posterior ECG Lead Placement