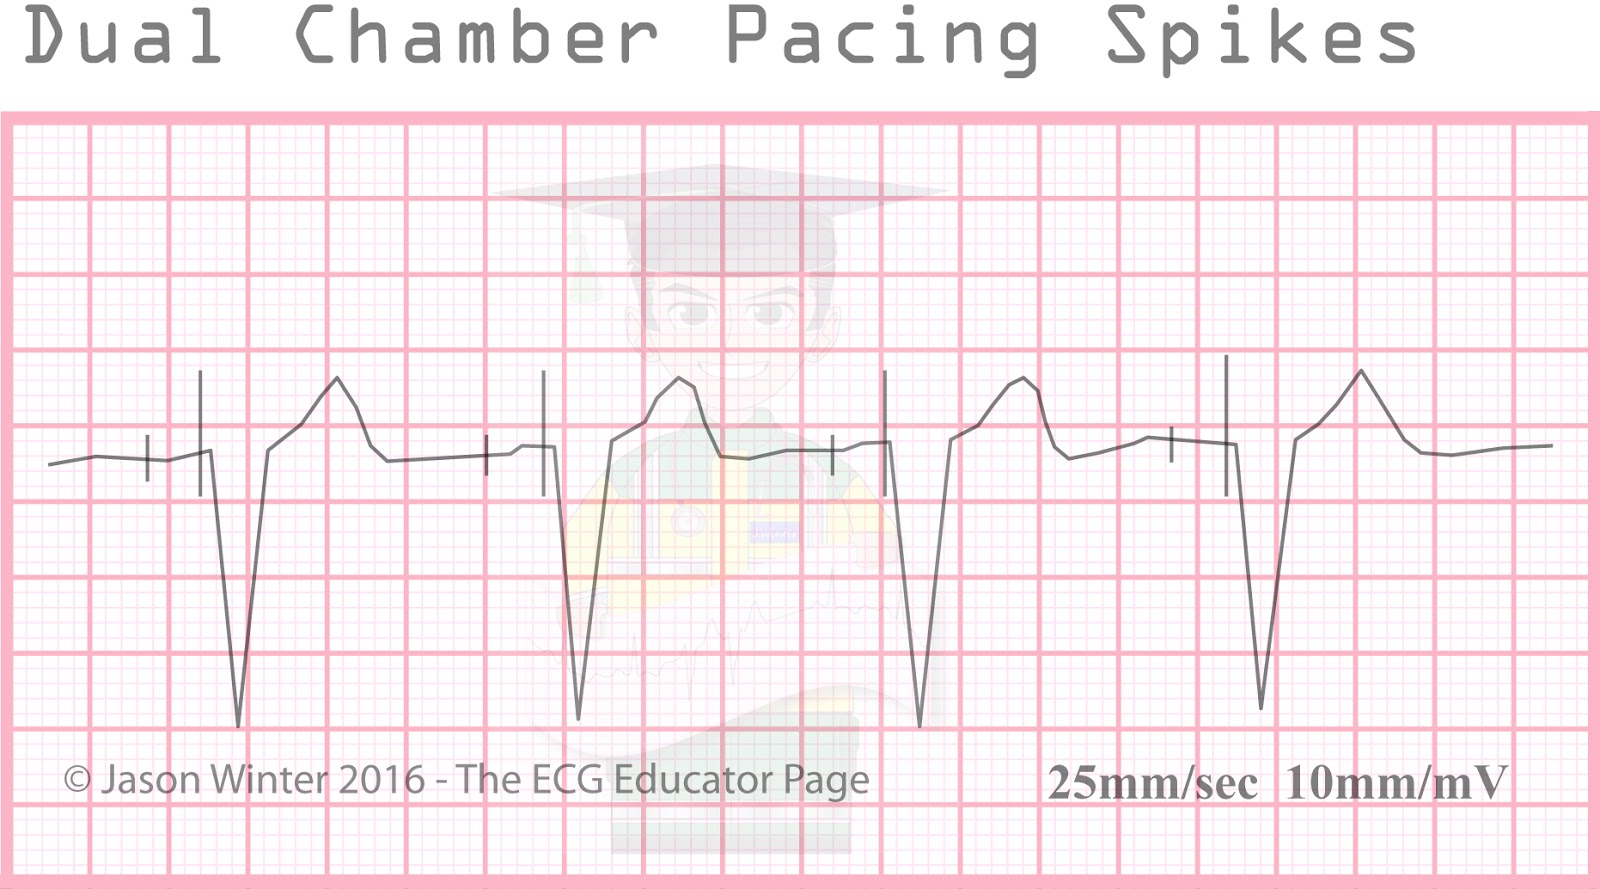
The heart’s electrical activity is represented on the monitor or ECG tracing by three basic waveforms: the P wave, the QRS complex, and the T wave. A U wave is sometimes present.
Between the waveforms are the following segments and intervals: the PR interval, the ST segment, and the QT interval. Although the letters themselves have no special significance, each component represents a particular event in the depolarization–repolarization cycle.
There are several methods for determining heart rate. Our first method is simple. Count the number of QRS complexes over a 6 second interval. Multiply by 10 to determine heart rate. This method works well for both regular and irregular rhythms. In the first image, we can count 5 QRS complexes, so the heart rate is 50.
The second method uses small boxes. Count the number of small boxes for a typical R-R interval. Divide this number into 1500 to determine heart rate.
ECG tracings are recorded on grid paper. The horizontal axis of the
ECG paper records time, with black marks at the top indicating 3 second intervals. Each second is marked by 5 large grid blocks. Thus each large block equals 0.2 second. The vertical axis records EKG amplitude (voltage). Two large blocks equal 1 millivolt (mV). Each small block equals 0.1 mV. Within the large blocks are 5 small blocks, each representing 0.04 seconds.